Sunday, June 24, 2012


Measuring Sugar Content of a Liquid 
with a Laser Pointer


Abstract

We will be using a laser pointer pen and some knowledge of physics to determine the concentration of sugar dissolved in a liquid.


Objective

The objective of this experiment is to see if sugar concentrations in water can be determined using the index of refraction of the solution.

Introduction
No doubt you have noticed the odd "bending" effect that you see when you put a straw (or pencil) in a glass of water. The water refracts the light, so the straw appears to bend at an angle when you look at the interface between the air and the water.

Compare the two images below and see if you notice anything different between them.


These two images illustrate refraction by liquids. Which glass contains plain water, and which glass contains sugar-water?


Snell's Law describes the physics of refraction (see below).


Watch a video to learn all about light and how it refracts: 


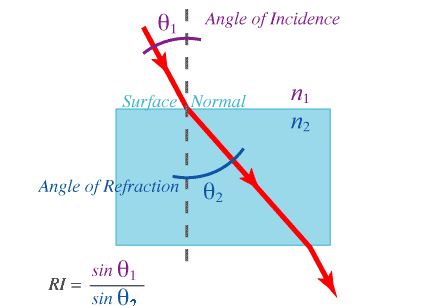
If we follow a light ray (red) as it passes from air to water, we can see how the light bends.  

Air and water each have a different index of refraction (symbolized by the variable n).

Snell's Law describes the angle of refraction of a light ray in terms of the angle of incidence and the index of refraction of each of the materials through which the light is passing (air and water in this case).


In optics, angles are measured from a line perpendicular to the surface with which the light is interacting. This line is called the surface normal, or simply, the normal (dashed gray line above).

The angle of incidence, θ1, and the angle of refraction, θ2, are shown.  

Snell's Law says that the relative index of refraction of the two materials (RI = n2/n1) is equal to the sine of the angle of incidence (sine θ1) divided by the sine of the angle of refraction (sine θ2).

What Snell's Law tells us is that the greater the relative index of refraction, the more the light bends.


The index of refraction of a liquid depends on the density of the liquid.  Dissolving sugar in water results in a solution with density greater than that of water alone.  Since sugar water is denser than plain water, sugar water should have a higher index of refraction than plain water.
In the two glasses above, one glass has plain water and the other glass has sugar water. 

Can you tell which is which?

You will learn how to use the physics of refraction to measure the sugar content of a clear liquid solution (e.g., apple juice, or a clear soda drink). 

You'll use a laser pointer and a hollow glass prism (which you'll be shown how to make).


Below you see a diagram of the setup.

Diagram of setup for measuring the index of refraction of a liquid using a laser pointer and a hollow triangular prism (not to scale).


When there is no liquid in the prism, the laser light (dotted red line) will shine straight through to a wall (solid black line). 

When the prism is filled with liquid, the laser light will be refracted (solid blue and red lines). 

The angle of deviation will be at a minimum when the light passing through the prism (solid blue line) is parallel to the base of the prism.

You'll have to rotate the prism just right so that this is true. 

Then you'll measure two distances, x and L, and use them to calculate the angle of minimum deviation. 

From this angle, you can calculate the index of refraction. Equation 1 is the formula for doing this.


Equation 1 looks complicated at first, but it's actually not so bad. 

θmd  is the angle of minimum deviation, which you will measure (you'll be shown how in the Experimental Procedure section). 

θp  is the apex angle of the prism. Since the prism is an equilateral triangle, the apex angle is 60°.

In equation 2, we've substituted 60° for θp.

In equation 3, we've substituted the numerical value of the index of refraction of air (nair = 1.00028).

The sine of 30° is 0.5, so we've made that substitution in equation 3.


Finally, we simplify the numerical terms to produce Equation 4, which is the one you will use.

Plug in your measured value for θmd, add 60°, and multiply the result by one-half.

Then take the sine of the result, and multiply by 2.00056, and you'll have the desired index of refraction.

LASER SAFETY GUIDE


Laser pointers have the potential to permanently damage your eyesight if misused! Read and follow these safety precautions when using laser pointers!
  • Before turning on the laser pointer, always be sure that it is pointed away from yourself and others.
  • Never look directly into a laser pointer.
  • Never direct a laser pointer at another person.
  • Follow the same rules for direct reflections of laser light from reflective surfaces.
A laser is a light source that can be dangerous to people exposed to it. Even low power lasers can be hazardous to a person's eyesight. The coherence and low divergence of laser light means that it can be focused by the eye into an extremely small spot on the retina, resulting in localised burning and permanent damage in seconds. Certain wavelengths of laser light can cause cataracts or even boiling of the vitreous humor, the fluid in the eyeball. Infrared and ultraviolet lasers are particularly dangerous, since the body's "blink reflex", which can protect an eye from excessively bright light, works only if the light is visible.

Classification


Lasers are classified by wavelength and maximum output power into the following safety classes:

Class 1: A class 1 laser is safe under all conditions of normal use. This means the maximum permissible exposure (MPE) cannot be exceeded. This class includes high-power lasers within an enclosure that prevents exposure to the radiation and that cannot be opened without shutting down the laser. For example, a continuous laser at 600 nm can emit up to 0.39 mW, but for shorter wavelengths, the maximum emission is lower because of the potential of those wavelengths to generate photochemical damage. The maximum emission is also related to the pulse duration in the case of pulsed lasers and the degree of spatial coherence.

Class 1M: A Class 1M laser is safe for all conditions of use except when passed through magnifying optics such as microscopes and telescopes. Class 1M lasers produce large-diameter beams, or beams that are divergent. The MPE for a Class 1M laser cannot normally be exceeded unless focusing or imaging optics are used to narrow the beam. If the beam is refocused, the hazard of Class 1M lasers may be increased and the product class may be changed. A laser can be classified as Class 1M if the total output power is below class 3B but the power that can pass through the pupil of the eye is within Class 1.

Class 2: A Class 2 laser is safe because the blink reflex will limit the exposure to no more than 0.25 seconds. It only applies to visible-light lasers (400-700 nm). Class-2 lasers are limited to 1 mW continuous wave, or more if the emission time is less than 0.25 seconds or if the light is not spatially coherent. Intentional suppression of the blink reflex could lead to eye injury. Many laser pointers are class 2.

Class 2M: A Class 2M laser is safe because of the blink reflex if not viewed through optical instruments. As with class 1M, this applies to laser beams with a large diameter or large divergence, for which the amount of light passing through the pupil cannot exceed the limits for class 2.

Class 3R: A Class 3R laser is considered safe if handled carefully, with restricted beam viewing. With a class 3R laser, the MPE can be exceeded, but with a low risk of injury. Visible continuous lasers in Class 3R are limited to 5 mW. For other wavelengths and for pulsed lasers, other limits apply.

Class 3B: A Class 3B laser is hazardous if the eye is exposed directly, but diffuse reflections such as from paper or other matte surfaces are not harmful. Continuous lasers in the wavelength range from 315 nm to far infrared are limited to 0.5 W. For pulsed lasers between 400 and 700 nm, the limit is 30 mJ. Other limits apply to other wavelengths and to ultrashort pulsed lasers. Protective eyewear is typically required where direct viewing of a class 3B laser beam may occur. Class-3B lasers must be equipped with a key switch and a safety interlock.

Class 4: Class 4 lasers include all lasers with beam power greater than class 3B. In addition to posing significant eye hazards, with potentially devastating and permanent eye damage as a result of direct beam viewing, diffuse reflections are also harmful to the eyes within the distance called the Nominal Hazard Zone. Class 4 lasers are also able to cut or burn skin. In addition, these lasers may ignite combustible materials, and thus represent a fire risk, in some cases. Class 4 lasers must be equipped with a key switch and a safety interlock.

Old System


The safety classes in the "old system" of classification were established in the United States through consensus standards (ANSI Z136.1) and Federal and state regulations. The international classification described in consensus standards such as IEC 825 (later IEC 60825) was based on the same concepts but presented with designations slightly different from the US classification.
This classification system is only slightly altered from the original system developed in the early 1970s. It is still used by US laser product safety regulations. The laser powers mentioned are typical values. Classification is also dependent on the wavelength and on whether the laser is pulsed or continuous.

Class I: Inherently safe; no possibility of eye damage. This can be either because of a low output power (in which case eye damage is impossible even after hours of exposure), or due to an enclosure preventing user access to the laser beam during normal operation, such as in CD players or laser printers.

Class II: The blink reflex of the human eye (aversion response) will prevent eye damage, unless the person deliberately stares into the beam for an extended period. Output power may be up to 1 mW. This class includes only lasers that emit visible light. Some laser pointers are in this category.

Class IIa: A region in the low-power end of Class II where the laser requires in excess of 1000 seconds of continuous viewing to produce a burn to the retina. Supermarket laser scanners are in this subclass.

Class IIIa: Lasers in this class are mostly dangerous in combination with optical instruments which change the beam diameter or power density. Output power may not exceed 1-5 mW. Beam power density may not exceed 2.5 mW/square cm. Many laser sights for firearms and laser pointers are in this category.

Class IIIb: Lasers in this class may cause damage if the beam enters the eye directly. This generally applies to lasers powered from 5-500 mW. Lasers in this category can cause permanent eye damage with exposures of 1/100th of a second or less depending on the strength of the laser. A diffuse reflection is generally not hazardous but specular reflections can be just as dangerous as direct exposures. Protective eyewear is recommended when direct beam viewing of Class IIIb lasers may occur. Lasers at the high power end of this class may also present a fire hazard and can lightly burn skin.

Class IV: Lasers in this class have output powers of more than 500 mW in the beam and may cause severe, permanent damage to eye or skin without being magnified by optics of eye or instrumentation. These are cutting, etching and surgical lasers. Diffuse reflections of the laser beam can be hazardous to skin or eye within the Nominal Hazard Zone.
The laser powers mentioned above are rough indications; the classification is also dependent on the wavelength and on whether the laser is pulsed or continuous. Also, even a high power laser may be assigned to a low safety class if it is enclosed so that no laser radiation can leave the case and injure a person.

For experiments in your science fair project, you should always use Class I or II lasers. The low power of these lasers will minimize the chance of an accident.
In addition, please be aware that a laser beam can reflect off of a mirror, lens, watch surface, jewlery, or metallic tool. Reflections often stay unnoticed until an accident occurs, so please take preventative measures to ensure your safety before turning on the laser!

Credits

Source

Wikipedia. "Laser Safety."

Ok, I have below the materials and equipment needed so please become familiar with it.  Do some home research if you need clarification.

Materials and Equipment
To do this experiment you will need the following materials and equipment:
  • several 1" × 3" glass microscope slides,
  • diamond scribe or glass cutter,
  • ruler,
  • electrical tape,
  • epoxy glue (either 5-minute or 30-minute epoxy),
  • toothpicks,
  • laser pointer,
  • cardboard,
  • tape,
  • tape measure,
  • paper,
  • pencil,
  • piece of string,
  • sugar,
  • water,
  • graduated cylinder,
  • gram scale, such as the Fast Weigh MS-500-BLK Digital Pocket Scale, 500 by 0.1 G
  • calculator with trigonometric functions (sine, arctangent).

Experimental Procedure

Laser Pointer Safety

Adult supervision recommended. Even low-power lasers can cause permanent eye damage. Please carefully review and follow the Laser Safety Guide posted here.


Making the Prism from Microscope Slides

  1. Figure 3, below, shows the sequence of steps you will be following to make a hollow glass prism in the shape of an equilateral triangle (from Edmiston, 1999). The prism will hold a liquid as you measure the liquid's index of refraction.


    making a hollow glass prism from microscope slides
    Figure 4. Diagram of the sequence of steps for making a hollow glass prism (equilateral triangle) from microscope slides. The steps are explained below. (Edmiston, 1999)
  2. The goal is an equilateral prism that can hold liquid. It will be constructed from microscope slides and epoxy.
  3. Put a piece of black electrical tape across the face of the slide as shown above (Figure 4a). The tape should hang over the edge.
  4. Score the other side of the microscope slide with a diamond scribe or glass cutter as shown (Figure 4a). Use a straightedge to guide the diamond scribe. The two scribe lines should be one inch apart and perpendicular to the long edge of the slide. (If desired, before scribing you can mark the positions for the scribe lines with marker. The marker can later be cleaned off with a small amount of rubbing alcohol on a paper towel.)
  5. Now you will break the glass along the scribe lines. Hold the slide on either side of the first scribe line and bend the glass toward the taped side. Bend just enough to break the glass. Repeat for the second scribe line (Figure 4b).
  6. Now bend the glass away from the tape, allowing the tape to stretch (Figure 4c). Continue bending until the triangle closes.
  7. Place the prism on a flat surface to align the bottom edges. Use the overhanging tape to secure the prism in this configuration (Figure 4d).
  8. Adjust the edges of each face so that they align correctly. At each apex of the prism, the inside edges should be in contact along their entire vertical length.
  9. Follow the manufacturer's instructions for mixing the epoxy cement (usually you mix equal amounts from each of two tubes). Use a toothpick to apply epoxy to the inside corners of the prism to glue the three faces together (Figure 4e). The corners need to be water-tight, but keep the epoxy in the corners and away from the faces of the prism. Keep the bottom surface flat and allow the epoxy to set.
  10. When the epoxy in the corners has set firmly, mix up fresh epoxy and use a toothpick to apply it to the bottom edge of the prism. Glue the prism to a second microscope slide as shown (Figure 4f). The bottom edge needs to be water-tight, but keep the epoxy away from the faces of the prism.
  11. Allow the epoxy to set overnight, and then your prism will be ready for use.


Measuring the Index of Refraction of a Liquid
  1. Figure 5, below, is a diagram of the setup you will use for measuring the index of refraction of a liquid. (Note that the diagram is not to scale.)


    setup for measuring the index of refraction of a liquid using a laser pointer and a hollow triangular prism
    Figure 5. Diagram of setup for measuring the index of refraction of a liquid using a laser pointer and a hollow triangular prism (not to scale; based on the diagram in Nierer, 2002).
  2. The laser pointer should be set up so that its beam (dotted red line in Figure 5) is perpendicular to a nearby wall. You should attach a big piece of paper to the wall for marking and measuring where the beam hits. The height of the laser pointer should be adjusted so that it hits about half-way up the side of the prism. The laser pointer should be fixed in place. Check periodically to make sure that the beam is still hitting its original spot.
  3. When the prism is empty (filled only with air), then placing it in the path should not divert the beam. Mark the spot where the beam hits the wall when the prism is empty. When the prism is filled with liquid, the laser beam will be refracted within the prism (solid blue line). The emerging beam (solid red line) will hit the wall some distance away from the original spot of the undiverted beam. You will measure the distance, x, between these two points (see Figure 5).
  4. Figure 6, below, is a more detailed view of the prism which illustrates how to measure the angle of minimum deviation, θmd. You need to mark points ab, and c in order to measure the angle. Points a and b are easy, because they are project on the wall. Marking point c is more difficult, because it is under the prism. The next several steps describe how to mark point c.


    measuring the angle of minimum deviation
    Figure 6. Detail diagram showing how to measure the angle of minimum deviation (not to scale; based on the diagram in Nierer, 2002).
  5. Tape a sheet of paper to the table, centered underneath the prism.
  6. With the prism empty, on the sheet of paper mark the point where the beam enters the prism (point d in Figure 6). Then mark the point where the beam exits the prism (point e in Figure 6). Later you will draw a line between d and e to show the path of the undiverted beam.
  7. On the wall, mark the point where the undiverted laser hits (point b in Figure 6). (As long as the laser pointer stays fixed, this point should be remain constant throughout your experiment. It's a good idea to check it for each measurement.)
  8. Now add liquid to the prism. You want to rotate the prism so that the path of the refracted beam within the prism (solid blue line from d to fin Figure 6) is parallel with the base of the prism. (A pinch of non-dairy creamer in the liquid can help you visualize the beam within the prism, and should not have a significant effect on the index of refraction of the liquid.) When the prism is rotated correctly, mark the position of the emerging beam on the paper on the wall (point a in Figure 6). On the paper on the table, mark the point where the beam emerges from the prism (point f in Figure 6).
  9. Now you can move the prism aside. Leave the paper taped in place.
  10. Use a ruler to draw a line from point d to point e. This marks the path of the undiverted beam.
  11. Next, you want to extend a line from point a (on the wall) through point f (on the table). To do this, stretch a string from point a so that it passes over point f. Mark the point (c) where the string crosses the line between d and e.
  12. Measure the distance, x, between points a and b, and record it in your data table.
  13. Measure the distance, L, between points b and c, and record it in your data table.
  14. The distances you have measure define the angle of minimum deviation, θmd. The ratio x/L is the tangent of the angle. To get the angle, use your calculator to find the arctangent of x/L. (The arctangent of x/L means "the angle whose tangent is equal to x/L.") Record the angle in your data table.
  15. Now that you have the angle of minimum deviation, you can use equation 4 to calculate the index of refraction, n, of the liquid in the prism.


    equation 4: calculating index of refraction from angle of minimum deviation
  16. To check that your setup is working, plain water should have an index of refraction of 1.334.
Standard Sugar Solutions for Comparison
  1. Use the following table for amounts of sugar and water to use in order to make 5%, 10%, and 15% sugar solutions.
    desired concentrationamount sugar (g)amount water (mL)
    5%595
    101090
    151585
  2. Measure the index of refraction of each sugar solution.
  3. Now measure the index of refraction of a solution with unknown sugar concentration (e.g., a clear soft drink or fruit juice). If you measure a carbonated beverage, make sure that there are no bubbles in the path of the laser (gently dislodge them from the side of the glass, if necessary).
  4. With the index of refraction of the unknown solution, combined with the data you have from your known sugar solutions, you should be able to estimate the sugar concentration of the unknown solution.
Variations
  • Compare the index of refraction of regular and diet soda. Is there a difference?
  • Can you use index of refraction to measure different the concentration of salt dissolved in water? Make salt solutions with different known concentrations and find out. If you live near a body of salt water, can you use this method to estimate the salt concentration of salt water samples from different locations? This would be especially interesting to measure where fresh and salt water meet, e.g., in a tidal estuary where a river or stream meets a bay or the ocean.
  • Advanced. Slowly pour water containing a pinch of non-dairy creamer over a layer of sugar crystals in the bottom of an aquarium, trying not to allow too much turbulence to develop in the water. Wait for an hour or two to allow a concentration gradient to form as the sugar crystals dissolve. Predict what will happen when a beam of light shines through the solution. Shine a laser pointer through the solution. Can you account for the path that the beam follows in the liquid? (http://www.sasked.gov.sk.ca/docs/physics/u3c12phy.html)


Sources

Career Focus

If you like this project, you might enjoy exploring related careers.

Physicist
Physicists have a big goal in mind—to understand the nature of the entire universe and everything in it! To reach that goal, they observe and measure natural events seen on Earth and in the universe, and then develop theories, using mathematics, to explain why those phenomena occur. Physicists take on the challenge of explaining events that happen on the grandest scale imaginable to those that happen at the level of the smallest atomic particles. Their theories are then applied to human-scale projects to bring people new technologies, like computers, lasers, and fusion energy.
Physics Teacher
Our universe is full of matter and energy, and how that matter and energy moves and interacts in space and time is the subject of physics. Physics teachers spend their days showing and explaining the marvels of physics, which underlies all the other science subjects, including biology, chemistry, Earth and space science. Their work serves to develop the next generation of scientists and engineers, including all healthcare professionals. They also help all students better understand their physical world and how it works in their everyday lives, as well as how to become better citizens by understanding the process of scientific research.

Photonics Technician
Do you enjoy watching cable television, texting on your phone, and surfing the Internet? Do you know anyone who has had eye surgery and been back to normal the next day? Many of the advances in telecommunications and medicine are due to laser and fiber-optic technology. This technology has led to devices that provide faster and richer communication, advanced surgeries, and faster healing times, as well as amazing robotics for manufacturing. But, as with all equipment, someone has to install and maintain it. That is what photonics technicians do. These professionals are responsible for building, installing, testing, and maintaining optical and fiber-optic equipment such as lasers, lenses, and optics systems. Photonics technicians contribute to the technology that has drastically changed how we communicate and how we live.


Terms, Concepts, and Questions to Start Background Research


Measuring Sugar Content of a Liquid with a Laser Pointer


Below you will find the background information you need to be successful in performing the above titled laboratory experiment. 


To do this project, you should do research that enables you to understand the following terms and concepts:
  • index of refraction,
  • density,
  • prism,
  • Snell's law.


Bibliography
  • Here are some online sources of information on Snell's Law. Although you only need a basic understanding of how Snell's Law works for this project, more advanced sources are included for those who wish to gain a more thorough understanding about the mathematics behind Snell's Law and how it can be derived from Fermat's Principle of Least Time:
    • A simple summary of Snell's Law (the basic "plug in the numbers and calculate" version that's required for this project):
      Kaiser, P., 2005. "Snell's Law," The Joy of Visual Perception [accessed September 25, 2006] http://www.yorku.ca/eye/snell.htm.
    • A fairly comprehensive tutorial that builds an intuitive understanding of Snell's Law by using high school level math:
      Henderson, T., 2004. "The Mathematics of Refraction, Snell's Law," The Physics Classroom, Glenbrook South High School, Glenview, IL [accessed September 25, 2006] http://www.glenbrook.k12.il.us/gbssci/Phys/Class/refrn/u14l2b.html.
    • (This one is only for highly advanced students!) A highly mathematical discussion of Snell's Law that includes its derivation from Fermat's Principle of Least Time (uses first-order differential calculus):
      Weisstein, E.W., 2006. "Snell's Law," Eric Weisstein's World of Science [accessed September 25, 2006]http://scienceworld.wolfram.com/physics/SnellsLaw.html.
  • Information on making the hollow prism for this project came from:
    Edmiston, M.D., 2001. "A Liquid Prism for Refractive Index Studies," Journal of Chemical Education 78(11):1479–1480, [accessed October 2, 2006] available online at: http://www.jce.divched.org/hs/Journal/Issues/2001/Nov/clicSubscriber/V78N11/p1479.pdf.
  • The images illustrating refraction in the Introduction are from Robin Wood's page about the technicalities of making refractive index look correct in images that are rendered by software:
    Wood, R., 2003. "Refraction Index," [accessed October 2, 2006]http://www.robinwood.com/Catalog/Technical/Gen3DTuts/Gen3DPages/RefractionIndex1.html.